
 Canadian
Trip Analyzer
How to Use the Trip Analyzer
This web software tool is designed for post-trip analysis of any electric vehicle journey that has been logged with a Cycle Analyst. The Cycle Analyst does not itself log your trip data, so in order to have these stats you need to capture and save the data stream to a computer using a communications cable or a hardware saving device such as the Cycle Analogger.
Upload Trip Data
The first step in using this software tool is to upload the data file(s) for the trip in question. There are three buttons at the top of the screen for this, and clicking each one will produce a pop-up dialogue for selecting the file from your computer.

- Choose a CA File: This will be the tab delinimated text file as directly recorded from either a V2 or V3 Cycle Analyst. The expected format for the first 5 columns is Amp-hours, Volts, Amps, Speed, and Distance. If the data was captured from a Cycle Analogger, then it will have a default file name format of CAlog_XX.txt The upload process will automatically determine if the file was saved at 1Hz or 5Hz, but you will need to indicate at the time of upload if it was created with the CA using metric (km) or imperial (mi) distance units.
- Choose a GPS File: If you have a NMEA formatted GPS file capture that starts and ends at the same time as the CA file, then you can also upload the GPS file separately in order to generate a route map and link your consumption stats to locations on the trip. If you have a GPS Analogger, then every CA Log file will have a corresponding GPS Log File. So if you uploaded CALog_23.txt, you would want to locate GPSlog_23.txt as the corresponding GPS file.
- Choose a KML File: This is for a single file combined CA+GPS data format that is still in development and not yet implemented. It is hoped that a combined file will facilitate using this web application with CA data saved via smartphone apps and would eliminate potential GPS+CA file synching issues.
Once the appropriate files have been selected, click "Submit" and the web software will locally scrutinize the files and if there are no major issues it will show all the trip data in graphs and statistics. If only a CA file was uploaded then you'll get the graph data and statistics without a map of the route.
During this process, there is nothing that is transfered to our web server, everything is done locally on your computer. An internet connection is required to see the GPS trip route on google maps, but the graphing and statistics will work fine even without an internet connection.
Results Plot
 After a succesful trip upload, you should see a map of your route in the top pane (assuming GPS data was included), and a graph underneath that allows you to display plot of all the data.
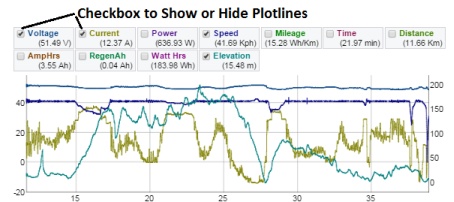
If you hover anywhere on the graph, a bicycle icon will display the corresponding location on the map while the graph legend will show all your relevant details at that point. How fast you were going, how many watts you were using, your battery voltage, consumed amp-hours etc. If you have GPS data, then it will also show the elevation and allow the plot of your elevation profile.
The graph itself can get confusing with so many values to plot, so you have the ability to check and uncheck just the plots that are of interest to you and hide the rest. The legend and plotlines are colour coded to match, and the 'Y' axis scaling is automatic.
Sections
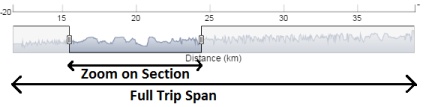
One of the more useful aspects of this software is the ability to zoom in and focus on individual sections within a trip. So if you uploaded a long adventure but are specifically interested in how much energy went into climbing a particular hill, you can use the left and right sliders to highlight just this one section in particular. The route map will continue to show the full trip in blue, and the selected section will be highlighted in red.

The area on the right shows all all the statistics for just this part of the trip, just as if you had reset the Cycle Analyst just at the start of the section and looked at the results at the end. You can see the consumption in Wh/km, the average and max speeds, the total time required, %regen recaptured, and if valid GPS data is present you can also see the total elevation change and average grade hill. This data is separated into a Summary section, useful averages, and peak values.
Example stats for a given section. Most should be self explanatory, but you can hover over for further details.
Extended Data
With a V3 Cycle Analyst having data from temperature sensors, pedal sensors, torque sensors, throttle signals etc, there are many more data columns stored than just the Volts, Amps, and Speed info. This data is in columns 6 and beyond and if present, it will show up as an extended data set on a second graph below the primary graph.

The extended data set is handled in a more general purpose manner than the core statistics, and you can choose not only which variables are plotted, but also how they are named, whether they are scaled on the left or right axis, if and how they are averaged for statistics etc. This is done by clicking on the "Edit Series" link, which will produce a pop-up like so:

By default, the software will assume that the extended data matches the formatting of a V3 Cycle Analyst, but you have the ability to plot any data of your choice here as well that is logged at the same rate by pasting it in a column in the original data file. When presenting statistics on a variable you have the choice of showing the average of all values, or just accumulating average amounts when the varlable is greater than zero. That way if you want to know your average pedal cadence for instance, you ignore all the times when you are coasting or stopped from bringing the average down.
Saving and Sharing Trip
As mentioned previously, this software was written to operate client side on your browser very much like a stand alone application and does not exchange any data with our servers. However, if you would like to upload your trip to the web and provide a link to share it with others, we have provided that functionality as well.
When you click the button "Upload Trip", the software will transfer all the statistics and saved sections to be hosted on our web servers and will provide a URL that you can give to anyone to view this trip log. You'll be given the option to provide a name and to choose between uploading the entire trip or just the currently selected section. We recommend keeping the trips uploaded to sections of 1hr or less in order to reducing the loading and lag times. You'll be warned if uploading a very large file.

Cookies on the browser are used to maintain a history of recently uploaded trip URLs in case these are lost, and the "Recent Trips" button will bring up a quick drop down list of these.
Advanced Topics
X Axis Choice
We provide 3 different options for the horizontal axis of the graph plots which can be useful in different circumstances

- Time: In a time plot, the 'X' axis shows the elapsed time since the start of the trip, rather than the distance covered. Any time periods when you are stopped will show up as long sections with zero speed. A time plot will tend to show the slow regions of your trip occupying a larger percentage of the graph than a distance plot, since you take more time to cover a given distance going slowly than going fast.
- Amp-Hours: With an amp-hour plot, you can see your statistics plotted against the accumulated amp-hours from the battery. This function is intended primarily for those using this software to produce battery discharge plots from CA data of a constant discharge through a load. It is a bit goofy for plotting actual vehicle trips, especially if there is regenerative braking and the amps go negative.
- Distance: By default, the plot will show your usage plots versus a distance axis, as that correlates best with the map and elevation profile look. In this plot, any periods where you are stopped and the speed is 0 will not show up since they occupy an infinitesimal amount of distance space, and regions where you are travelling fast will account for a large portion of the graph space.
Tips for Data Synchronization
It's important to note that the Cycle Analyst does not transmit data when it is inside the setup menu. If over the course of a trip you enter the setup menu to change a setting and then leave it, the log file will be missing data from this period, while the GPS file will keep accumulating, and the result will be a CA file and GPS file loosing sync at this point. If you are logging data on a trip, we recommend turning the ebike off and on after changing anything in the CA's setup menu in order to start a new data and GPS file that are properly synchronized. You can easily merge the files together afterwards in a text editor if you want them to be treated as a single trip.
If over the course of a trip you reset the Cycle Analyst without shutting down power, then the CA's amp-hour and distance values will be restarted at zero, but the trip analyzer software will continue to show the accumulated Ah and Distance from the start of the trip as though you did not press reset.
Capture Rate and Averaging
Both V2 and V3 CA's have the ability to log data at either 1Hz or 5Hz. The 1Hz rate is fine for accumulating statistics over long trips with a reasonable file size, but it does not show much detail when you zoom in on short sections. For closer analysis a 5Hz logging rate is much more interesting. However, if the CA's display averaging is set at it's default value, then the data will still have staircasing patterns at this longer rate. To avoid this, use a display averaging of 0.15 Seconds in the CA's setup menu when logging data at 5Hz.
GPS File Accuracies
While GPS sensors are generally accurate in their coordinate positioning, they can become widely inaccurate in the presence of tall structures and buildings, or when travelling through tunnels or under overpasses. And while the longitude/latitude accuracy is usually quite good, the elevation accuracy is not nearly as precise. Even away from tall buildings and similar disturbances, it's not unusually to see erroneous spikes in the elevation plot. When there is a GPS file present, then the software has the opportunity of collecting speed and distance data both from the CA's data file or from the GPS file. We felt it was most consistent to rely on the CA's data for this, but that does assume that the user has input their wheel circumference correctly.